
Documented history
Two years of documented, backtested data.
January 2024 → December 2025 · presented separately from the 2026 results (in live market conditions).
Average annual gain over the period
+107 %
+€12,914 cumulative netCalculated on initial capital.
How to read this data
A historical view of the method.
The average annual gain is calculated on initial capital for this defined period. It does not represent automatic compounding or an increase in contract size.
The essential distinction
2026 remains a distinct period.
The 2026 results correspond to execution in live market conditions, with a 1 MNQ configuration and exchange fees deducted.
2024–2025 ProRealTime reports
Detailed documents for the historical period.
Both supporting documents are available in full format.
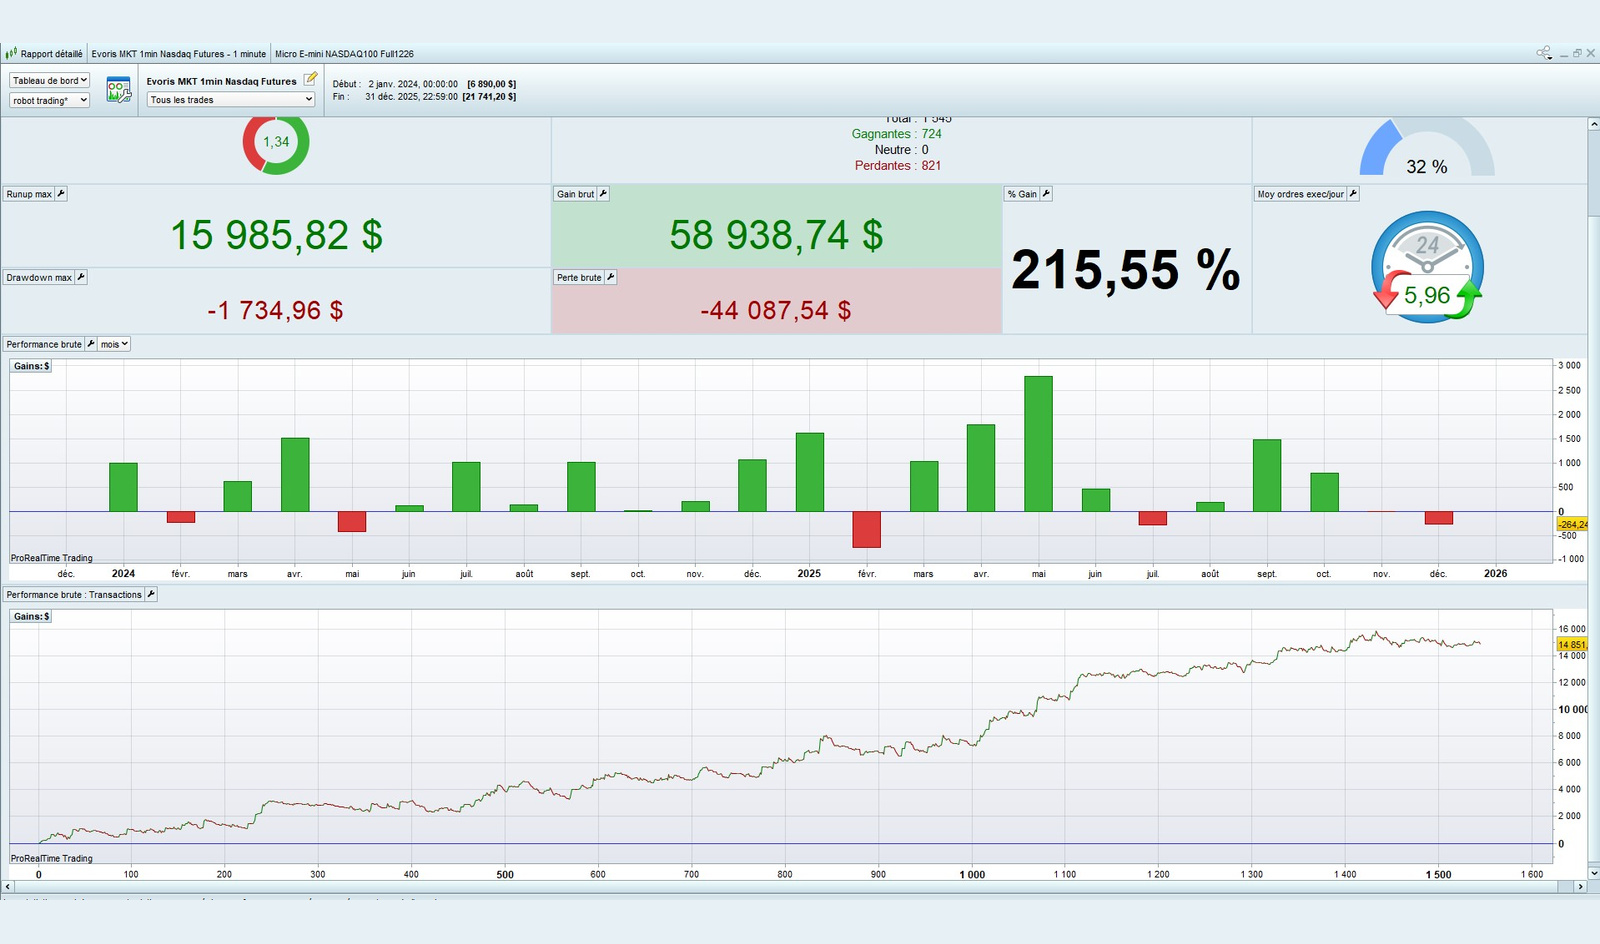
Detailed report
Performance and trajectory.
Overview of performance over the historical period.
Open the report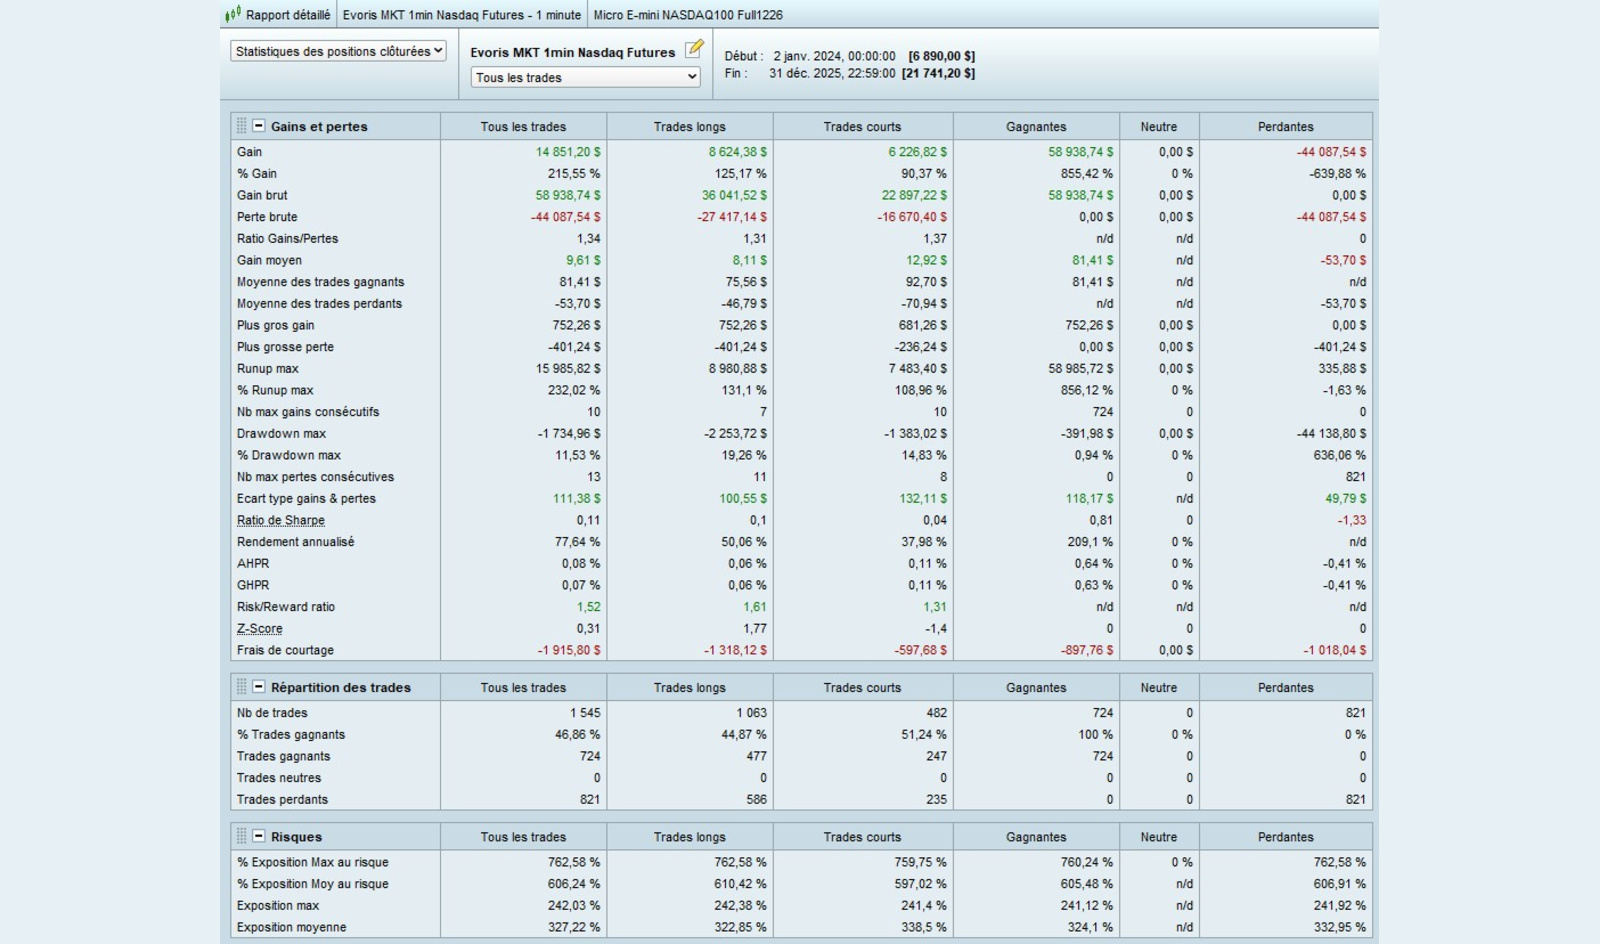
Detailed statistics
Result structure.
Breakdown of trades, gains and losses, risk and drawdown.
Open the statistics
